
Craig James is CommSec’s Chief Economist reviews the events of the last quarter. and in this report James looks at making sense of the volatile markets for your understanding.
Economic & financial trends
Shares slide: The US Dow Jones share index fell by 391 points or 2.4% on Friday.
Volatile markets: In Australia over the past year there have been 85 daily moves on the ASX 200 index of more or less than 1%– a 3½-year high using annual rolling averages.
Expensive US stocks: The over-priced US share market is contributing to the unsettled times. The US share market is over-valued by around 10%. The Australian share market is reasonably valued based on historic averages.
What does it all mean?
Financial markets are volatile. While that is hardly a new statement, investors have been on somewhat of a roller-coaster ride – not just in recent days or weeks but stretching back to 2014.
Much is happening, from plunging oil prices to rebalancing of the Chinese economy to geopolitical issues such as the threat from ISIS. Investors and analysts are asking a range of questions and the answers are unsatisfying. Will the Chinese economy experience a hard landing? How far will oil prices fall? What impact will falling oil prices have on oil producers and banks? Will the US still lift interest rates?
Unlike the global financial crisis (GFC), share markets in recent times have been characterised by shorter-term sell-offs and then recoveries rather than straight-line longer-term weakness (months, rather than weeks) and longer-term recoveries.
The GFC was the biggest economic downturn for many developed nations such as Europe and the US since the Great Depression. But the share market slide over 2008/09 was largely repaired over 2009/10. It gets down to central banks and how committed and effective they are in engineering recovery. Unfortunately in recent months central banks haven’t exhibited the same degree of leadership.
What has been lost in the recent bout of volatility is that there has been no single spark, no single factor to blame. What also has been lost is the role played by technology. Technology is responsible for ‘disruption’ hitting businesses; the structural impact in causing dis-inflation and the ability of companies to slash costs quickly in response to lower prices. So prices like the price of oil have to fall further to push higher-cost producers out of the market. Companies are reporting firmer profits but weaker revenues and the new paradigm is further unsettling investors.
Uncertainty hasn’t been resolved, so financial market volatility is likely to continue. Fundamentally the US economy is in good shape – otherwise the Federal Reserve wouldn’t have lifted interest rates. There have been signs of improvement in Europe. And the Australian economy remains in solid shape.
But it’s important to note that the US sharemarket still remains expensive. The forward price-earnings ratio for the S&P 500 stands at 16.5. The long-term average is 15. The US may want to blame China for the volatility but share prices are still too high in relation to earnings.
Once oil prices find their floor level, the lower prices will serve to boost consumer and business spending. Central banks will ensure that economic recoveries will continue. Investors are right to be alert but also need to remember the lessons of the past.
Taking stock – where are we at?
On Friday January 8 we wrote a report highlighting the wall of worry being climbed by investors at the start of 2016. The volatility hasn’t yet subsided. We noted at the time a raft of concerns:
- The continued slump in oil prices;
- A break in diplomatic relations between Saudi Arabia and Iran;
- Reported testing of a nuclear device by North Korea;
- Another batch of soft Chinese economic data;
- Depreciation of the Chinese currency (yuan);
- A slump in the Chinese sharemarket;
- Worries about the outlook for the global economy; and
- Uncertainty about the future timing of US rate hikes
In contrast to the volatile and generally weakening markets we noted that “economic data released in Australia and the US in recent days has been generally positive including data showing solid US jobs growth and record auto sales in both the US and Australia.”
That point still stands. Data out last week showed the Aussie jobless rate at 26-month lows. Job growth in 2015 was the highest in nine years. Retail trade is up 4.3% over the year, above the 5-year average of 3.7%. In the US, unemployment stands at 5.0% – a level that many analysts regard as being at or near full employment.
On Friday, the US Dow Jones share index fell by 391 points or 2.4%. European markets were similarly down 2-3%, Markets had already closed lower in Asia with the Hang Seng down 1.5% and the Australian ASX 200 down 16.6 points or 0.3%. At one point on Friday the ASX 200 was up by 68 points and the index traded in a 127 point range.
Earlier on Thursday the US Dow Jones had managed to climb by almost 228 points or 1.4 %.
So far this year the US Dow Jones has fallen by 8.2 % with the Nasdaq down 10.4 %. The ASX 200 has fallen by 7.6%, although it is tipped to fall again on Monday.
Volatility in context
The US Dow Jones index fell 11% in the space of 11 days from August 10 to August 25 last year. Over the similar time span the Australian ASX 200 fell by 9.2%. After treading water until late September, the Dow Jones index rallied again.
From September 28 to November 3 last year, the Dow Jones rallied 12% (the ASX 200 lifted 8.8 % from September 29 to October 23).
Since the recent peak on December 29, the US Dow Jones has fallen by almost 10% (9.8%, from 17,712 to 15,988 points. The ASX 200 has fallen by 8%.
The US Dow Jones index is currently down by 7.7% over the past year although the Nasdaq is only down by 1.8%. The Dow Jones index is down 14.4% from the all-time high set on May 19 2015.
The Australian All Ordinaries index is down 6.8 % over the year with the ASX 200 down by 8.2%.
The Global Financial Crisis (GFC)
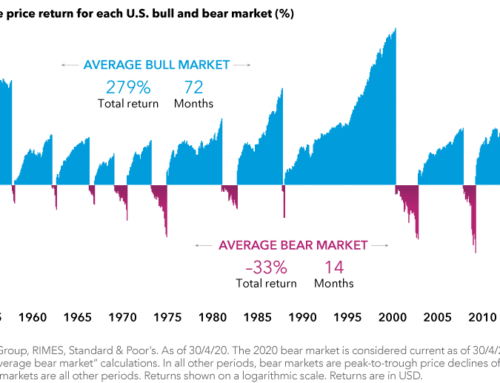
The past two years has been characterised by share market sell-offs and recoveries. In contrast the GFC period was characterised by a 10-month decline from May 2008 to March 2009 and then a 13-month recovery to April 2010. The decline wiped off almost 50% from the US Dow Jones index. The recovery ended up boosting the index by 68% to just over 11,000 points on April 12 2010.
The Australian ASX 200 peaked at 6,828.7 points on November 1 2007. It was an exaggerated peak, driven by the ‘once-in-a-century’ and unsustainable lift in mining and energy prices.
By March 18 2008 the ASX 200 had fallen by 25.5% from the highs.
The low point for the ASX 200 occurred at a similar time to the low in the US, occurring on March 6 2009 at 3145.5 points – a fall of 53.9% from the highs. From March 6 2009 to April 15 2010 the ASX 200 lifted 59% to 5,001.9 points.
Falling oil prices
On December 14 1998 the US Nymex oil price fell to US$10.83 a barrel – a halving of the price in around 14 months. By September 1999 the price had doubled to above US$22 a barrel.
On July 4 2008 the oil price hit a record high of US$145.29 a barrel, a doubling of price in around 11 months. In three months the oil price halved in a price.
The more recent peak for the oil price was in June 2015 at US$61.43 a barrel. In the past seven months the oil price has halved to US$29.42 a barrel. So volatility is no stranger to commodity markets.
Could the oil price fall to the lows of 1998? The answer is yes. But could it be sustained at the lows? That is more doubtful despite the cost declines and efficiency improvements by higher cost producers.
The Asian Financial Crisis from July 1997 did contribute to a global economic slowdown over 1998 and the weaker oil price. The global economy grew by 2.5% in 1998 but then lifted to 3.6% in 1999 and 4.8% in 2000.
No doubt slower global growth, including China, is one factor driving oil prices down. But the biggest factor is excess oil production as OPEC oil producers try and protect market share.
In the past, higher oil prices have been correlated with stronger world economic growth. But this time the shock is caused by both higher supply and slower demand. So a lower oil price should assist in boosting economic growth over 2016 once prices settle at lower levels.
For consumers, airlines, retailers, transport groups and a raft of other businesses, the low oil price is a very positive development. And given that Australia is a net buyer rather than seller of crude oil and refined products, the low oil price represents a boost to the economy.
China – hard or soft landing?
It’s not generally known that China’s fastest economic growth rate was back in 1984 at 15.2%. Growth slowed to 8.8% in 1996. More recently the economy grew by 14.2% in 2007 and has averaged 8.5% growth in the period since.
The Chinese economy is undergoing change, moving from an economy driven by manufacturing and mining to that driven by the services sector and household spending.
The economy is still very much an emerging or developing nation so greater flexibility and transparency will be required in financial markets in the years ahead.
China is struggling with the transition. But authorities will clearly do everything in their power to keep the economy growing at a sufficient pace to keep unemployment low, thus underpinning spending and ensuring the Chinese people remain contented about the standard of living.
Dividends and valuations
According to weekly data from FactSet, the forward price-earnings multiple for the US S&P 500 stands at 16.54. That is, shares are trading on average 16.54 times expected earnings. The 5-year average is 15.07 and the decade average is 15.03. So the US market could be considered 10% over-valued currently.
In Australia, the forward price-earnings multiple for the ASX 200 stands at 14.89. That is, shares are trading on average 14.89 times expected earnings. The 5-year average is 14.64 and the decade average is 14.42. So the Australian market could be considered slightly over-valued but generally the market isn’t too far away from where it “should” be.
Of course, looking at the PE ratio is just one way of assessing valuation. But there certainly seems to be a case for earnings to “catch up” with share prices in the US.
Each environment is different. Interest rates are far lower now than in the past, lifting the attraction of shares compared with other asset classes. Having said that, the risk preference of investors changes over time. Investors are probably a bit more cautious about investing than before the GFC. That makes it more difficult to determine the “right” valuation.
Still it is hard to describe Australian stocks as expensive.
And then there are dividends. Dividend yields on Australian stocks are high, reflecting lower share prices and the desire of companies to pay dividends.
Clearly though, companies don’t have to pay dividends. And dividend yields of some companies reflect poor fundamentals and lower share prices, remembering that yields are based on comparing current share prices with the last dividend paid.
The current dividend yield of 4.74% is not far off some of the “best” yields recorded. Yields were near 4.8-4.9% in 2011/12 and spiked to an unsustainable high of 6.8 % in the GFC. But the 5-year average is 4.38%; 10-year average 4.23% and 20-year average is 3.95%.
But investors need to assess whether it is reasonable to expect that a company will maintain dividends at previous levels, let alone lift dividends.
BHP-Billiton is trading on a dividend yield of 11.2%; NAB and ANZ are near 7.3%; Westpac is at 6.0% with Telstra at 5.7%.
Similarly in the US, the dividend yield stands at a 4-year high of 2.22%, a reflection of lower share prices and higher dividend payouts in recent years. While there is uncertainty about the payment of future dividends, the higher yields will eventually attract buying interest from investors.
What are the implications for interest rates and investors?
The Reserve Bank of Australia (RBA) will closely monitor developments in China and financial markets more generally. Encouragingly the Reserve Bank has plenty of firepower to provide stimulus to the economy.
Policy makers always stand ready to react as necessary. So if the volatility in financial markets was to spill over into the broader economy, central banks and governments would seek to add stimulus to their economies.
In Australia, the RBA is well placed to cut interest rates if necessary with the cash rate sitting at 2%. The Federal government could also add stimulus as necessary as it did successfully during the global financial crisis. The budget deficit of 2.5% doesn’t act as a barrier to stimulus as it remains relatively low compared with other major economies.
Just as the RBA will do all that it takes to protect the economy, we expect a similar determination by other central banks for their respective economies. The Chinese economy is rebalancing. And while activity in the manufacturing and mining sectors have slowed, consumer spending continues to grow at a double-digit pace in real (inflation-adjusted) terms.
We believe that worries about the Chinese economy are over-done. The economy is rebalancing and evolving and growth pains must be expected as the process continues.
As we noted at the outset, one factor generally over-looked in the market correction is that the US share market is still over-valued. The S&P 500 is trading on 16.5 times forward earnings. The long-term average is 15.0. Global trends of low inflation & disruption are playing a role, but analysts and investors need to work out how to price stocks in the current new world order.


Leave A Comment